Understanding and implementing Bezier Curves using HTML Canvas and Javascript
import { curves } from "bezier-curves";

Building intuitive and engaging (customer, developer, user, visual) experiences is my Ikigai.
TLDR; 2 weeks ago, I saw a video by Fireship titled "WTF is a Bézier Curve?" and realized Bezier curves are beautiful and implemented them myself.
Try it out here: https://sampath.dev/bezier-curve-js/
Source Code: GitHub repo
How do we draw something on a screen?
In reality, everything on the screen is a drawing. Think in terms of pixels on the screen. How would you draw a line?
Just like any line on a Graph paper. Consider any corner of the screen as (0,0) or origin and consider two points start and end to draw a line from and to. We can get the line by plotting points for each point in the locus of the linear equation of the line.
Now, how do we draw a curve?
Think about it... I'll wait.
Now, that I too thought about it, I came up with this very huge solution. Remember each point in the curve and re-plotting when necessary. Although that would work, it's a lot of storage space.
So, Pierre Bézier came up with a solution for that after being annoyed while drawing designs for the Renault automobile company. The underlying math was established by Bernstein, way before the advent of Bezier Curves but Pierre Bezier brought the math and applied it into computer graphics.
Now, the math is simple here. We need to first understand how we are plotting straight lines.
Drawing lines
Consider that we are drawing a line from (0, 0) to (100, 0). So, we are drawing a line from x = 0 to x = 100.
We need to plot a point at x = 0, x = 1, x = 2, x = 3 and up to x = 100. To get these values, we can make use of the following formula and plot all values of xi.
xi = (x2 - x1) * t + x1

where t is in the range [0, 1]
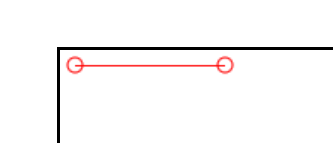 plotting the line y = 0 and x = [0, 100]
This is how we can draw a line and this process is called interpolation. Remember the t, we need it for later. Let's move on to drawing a curve.
Drawing curves
I'll try to make it as easy to understand as possible but pay close attention here. This is the crux of it.
We are interpolating here between two points start and end, (0,0) and (100,0) according to our line example. Let's add a new point control with the coordinate (50, 50). This point will now define our curve.
As usual, we will interpolate here as well, but we will perform it between the points (start and control) and (control and end).
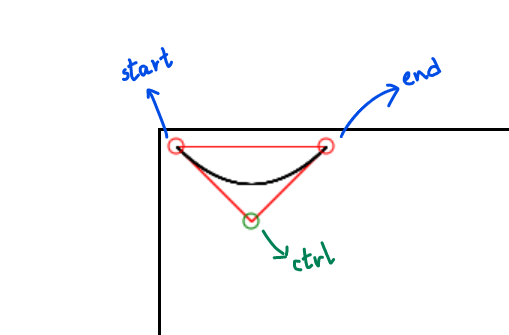
This will give us two new points for every value of t. Refer to the Drawing lines section if you don't know what this is. Let's consider them as pA and pB.
Now, for every value of pA and pB, we now interpolate between them. So, we will find the value as stated below.
pAt -> pA for a given value t, while interpolating between start and control
pBt -> pB for a given value t, while interpolating between control and end

pCt -> pC for a given value t, while interpolating between pAt and pBt
To make it much clear, let's consider the results for t =0. 1.
var xt = (p2.x - p1.x) * t + p1.x;

pA = ((50 - 0) * 0.1 + 0, (50 - 0) * 0.1 + 0) = (5, 5)
pB = ((100 - 50) * 0.1 + 50, (0 - 50) * 0.1 + 50) = (55, 45)

pC = ((55 - 5) * 0.1 + 5, (45 - 5) * 0.1 + 5) = (10, 9)
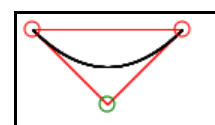
Similarly, we can find all the values of pC for every value of t in the range [0, 1]. Plotting these values on the graph will give us the following curve.
If you are confused about any step here, go back and read through the sections again or you can also comment where you are stuck and I'll try to elaborate if I can.
Multiple control points?
This curve here has just one control point, what if you need a curve with more than one control point? We can do that as well. We do the same operations as for the above curve and do it recursively.
The one we calculated above is called a Quadratic Bezier Curve. Similarly, one with two control points is called a Cubic Bezier Curve and so on.
Does my code perform all this interpolation?
The straight answer is 'No'. The reason is mathematics. Yes, it is necessary that we understand interpolation here to get the curve but in mathematics, we also have equations for curves. If we simplify the operation we are performing here, we can get a neat equation that we can use to get the point pC for a given value t.
This is what my code does.
// Quadratic Bezier Curve
// x(t) = (1−t)^2 * x0 + 2 * t * (1−t) * x1 + t^2 * x2

function calcQuadraticBezierCurveValue(c1, c2, control, t) {
    return Math.pow(1 - t, 2) * c1 + 2 * t * (1 - t) * control + Math.pow(t, 2) * c2;
}
// Cubic Bezier Curve
// x(t) = (1−t)^3 * x0 + 3 * (1-t)^2 * t * x1 + 3 * (1 - t) * t ^ 2 * x2 + t^3 * x3

function calcCubicBezierCurveValue(c1, c2, control1, control2, t) {
    return Math.pow(1 - t, 3) * c1 + 3 * Math.pow(1 - t, 2) * t * control1 + 3 * (1 - t) * Math.pow(t, 2) * control2 + Math.pow(t, 3) * c2;
}
A list of formulae for each type of Bezier curve can be found on Wikipedia here.
That's it, that's how we draw curves on our computer screens. That's some history and deep dive into how computers work. If you have suggestions or questions, drop them in the comments and let's talk. Feel free to play with the website and explore the source code.
It's a wrap!
![Scalability, Reliability and Maintainability [Tenglish]](/_next/image?url=https%3A%2F%2Fcdn.hashnode.com%2Fres%2Fhashnode%2Fimage%2Fupload%2Fv1759079554176%2F86761c98-abd6-4c0a-a763-cb7578149542.png&w=3840&q=75)